What would halving your multi-cloud bill actually do to your gross margin?
The math is interesting enough that everyone ends up running the numbers anyway.
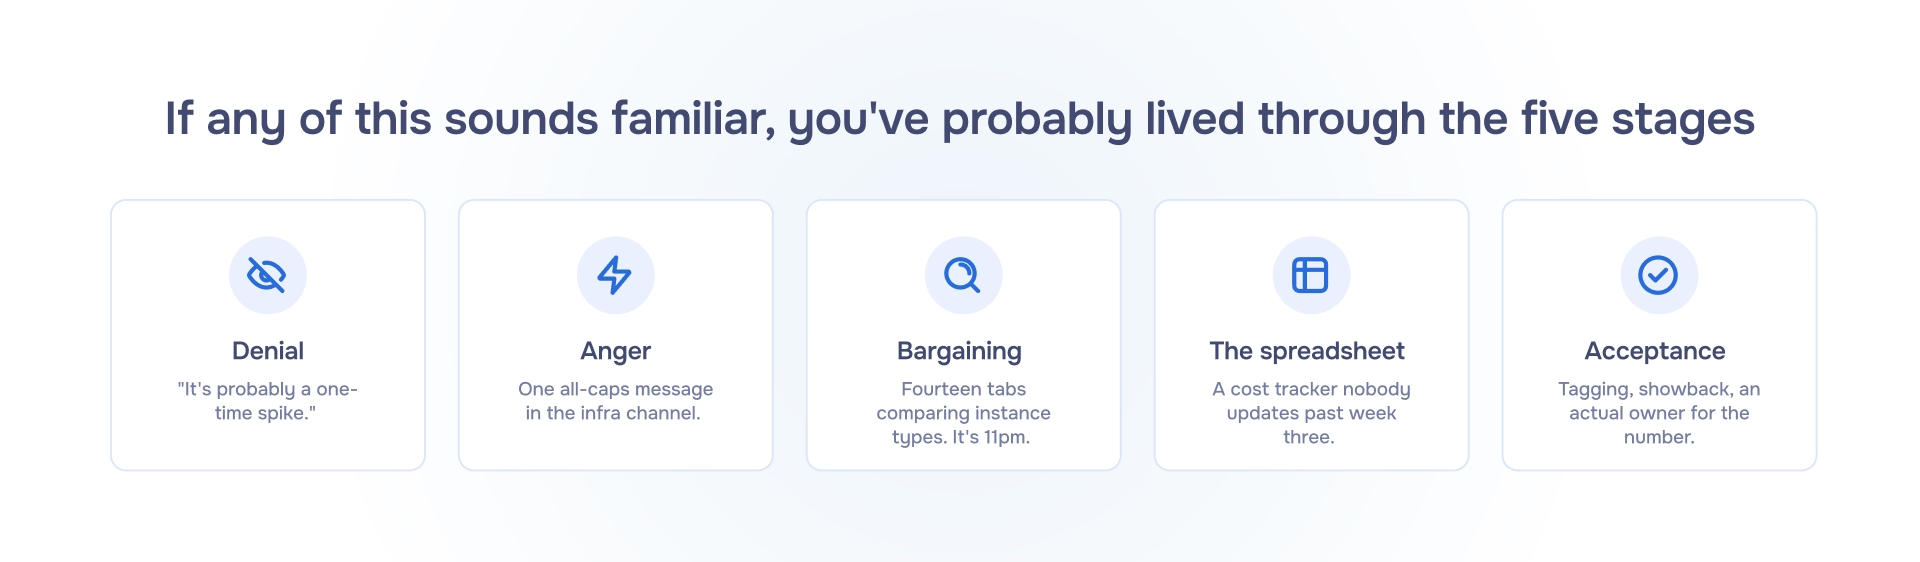
Somewhere in your Slack right now there’s a message from finance with a screenshot of a chart that only goes up, in the bad way. Nobody’s replied in four hours, because nobody has a number yet. Just a feeling that the AWS bill "seems high," and a vague plan to look into it after this sprint.
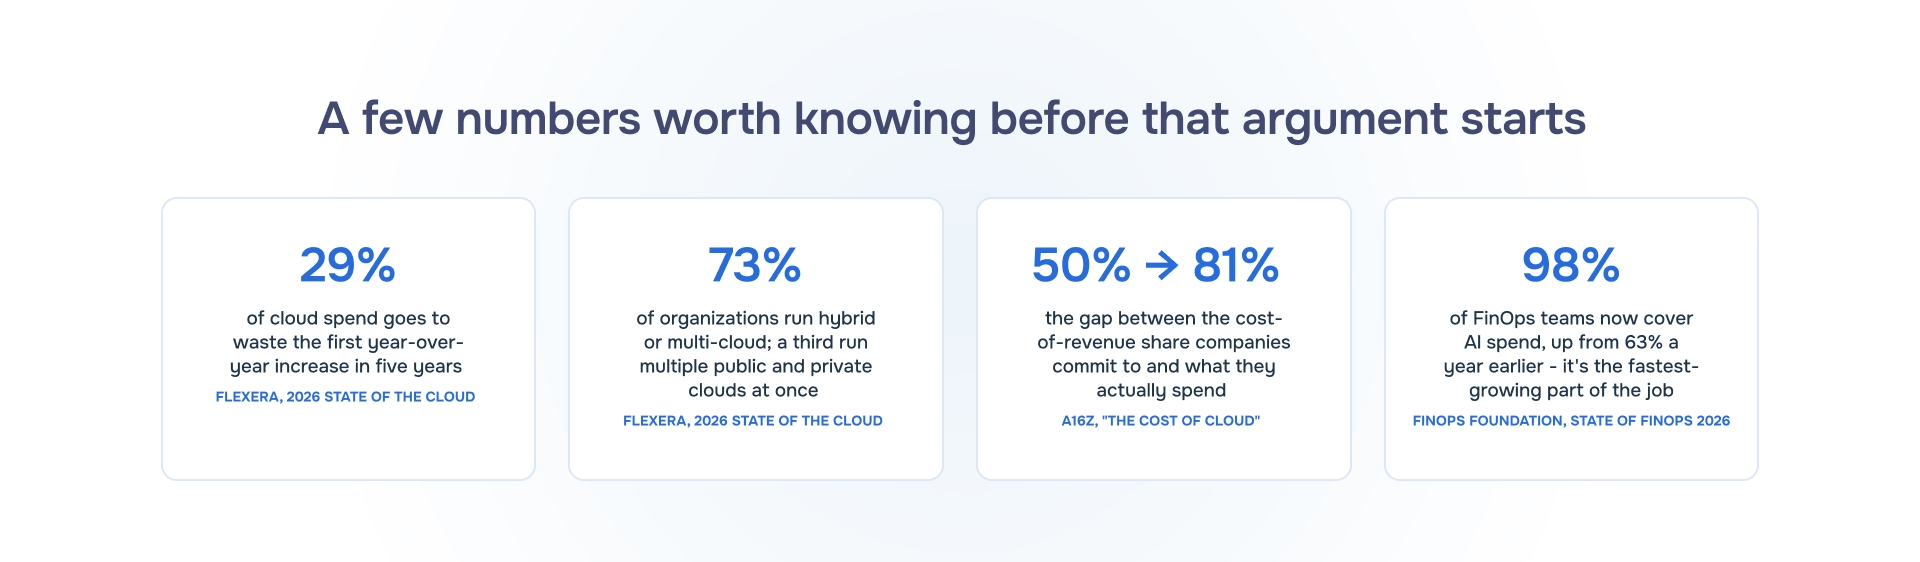
What’s annoying is that the answer is likely sitting in three different billing consoles, denominated in three slightly different currencies of confusion, and it’s still impossible to know for sure what any of it actually bought you. That’s a classic multi-cloud problem, and by most counts almost three-quarters of companies have one now, whether they meant to or not.
So before anyone builds another tracking spreadsheet, it’s worth doing the boring arithmetic first: what does cutting that number in half actually do to gross margin. The more typical question — whether you should cut cloud costs at all — is already settled.
Is cutting your cloud bill worth the effort at all?
It’s worth knowing both sides of the argument before anyone walks into a board meeting with a savings target.
The math, stripped of the poetry
Cloud spend almost always sits inside cost of goods sold. Which means every dollar you stop spending on it becomes a dollar of gross profit, dollar for dollar, at a rate no revenue dollar ever gets. To add a dollar of gross profit through sales, you have to sell enough at a positive margin to net that dollar after discounting, commission, and the cost of serving the account. To add it through cloud savings, you just... stop paying for the thing you weren’t using.
A dollar of cloud savings is a dollar of gross profit. No new logo, no discount, no sales cycle.
Public SaaS gross margins run roughly 72–78% at the median once companies reach real scale, with the best-in-class names sitting in the 83–88% range. The whole promise of the SaaS model is that each new customer should cost less to serve than the last one — and cloud spend can easily be the reason that promise does or doesn’t come true.
Meet Nimbus
Take a made-up company — call it Nimbus. $10M in ARR, spending $1.2M a year across AWS, Azure, and GCP combined. That’s 12% of revenue, right in the middle of the public SaaS benchmark range, running a 70% gross margin: fine, not great, for its stage.
If Nimbus’s platform team — or one very determined engineer with a weekend to spare — cuts that multi-cloud bill in half, that’s $600K back every year, forever, without touching a single customer contract. Not a hypothetical trend line. $600K straight into gross profit, moving Nimbus from 70% to 76% margin: the difference between "fine" and the top quartile of its own peer group.
Put another way, that’s roughly four additional senior engineers Nimbus could hire without spending a new dollar of revenue. Or, if Nimbus burns $400K a month, about six extra weeks of runway, conjured entirely from a bill nobody was watching closely enough.
Now, realistically, 50% is a little aggressive — difficult to achieve, but not fabricated. Deloitte’s 2025 FinOps research cites companies cutting cloud costs "as much as 40%" through FinOps practices, with real cases landing at 30–40% (Lyft hit a 40% per-ride cost reduction in six months, WPP got 30% annually). So, with your own target cloud-cost reduction in mind, do the Nimbus math with your actual numbers.
Try it live — your version of the Nimbus math
Same worksheet as above, except it updates as you type and it doesn’t know anything about Nimbus. The defaults below are Nimbus’s numbers — replace them with yours. This calculator is an interactive HTML/JS widget; a screenshot of the live version is below, followed by its HTML source for implementation.
Try it live
Your version of the Nimbus math
Same worksheet as above, except it updates as you type and it doesn't know anything about Nimbus. The defaults below are Nimbus's numbers — replace them with yours.
Your numbers
$
$
Combined AWS + Azure + GCP (+ anything else), before any reduction.
Advanced — hires & runway
$
$
Leave blank to skip the runway comparison.
Your multi-cloud spend is larger than your implied total cost of goods sold at this gross margin. The savings and margin numbers below still hold, but the chart's "other costs" segment has been floored at zero.
Annual savings
$600,000
▲$50,000 / month
New gross margin
76.0%
▲+6.0 pts vs today
Cloud spend as % of revenue
6.0%
down from 12.0%
Equivalent to 4.0 additional fully-loaded senior engineering hires — funded purely by the cloud-cost reduction.
Equivalent to 6.0 extra months of runway at your current burn rate.
Cloud spendOther COGSGross profit
Today
After halving cloud spend
Scenario
Cloud spend
Other COGS
Gross profit
Gross margin
Today
After
Methodology: margin points added = annual savings ÷ annual revenue. New gross margin = current gross margin + margin points added. Other COGS = (revenue × (1 − current gross margin)) − cloud spend. Hires equivalent = annual savings ÷ fully-loaded engineer cost. Runway equivalent = annual savings ÷ (monthly burn × 12), in months. Directional planning estimate, not a substitute for your finance team's model.
Why the bill looks like a crime scene in the first place
It isn’t because cloud is expensive — compute has gotten cheaper almost every year since AWS launched. Three things pile on top of each other instead:
Multi-cloud sprawl, often inherited through an acquisition or a "let’s not get locked in" decision nobody revisited once the reasoning stopped applying.
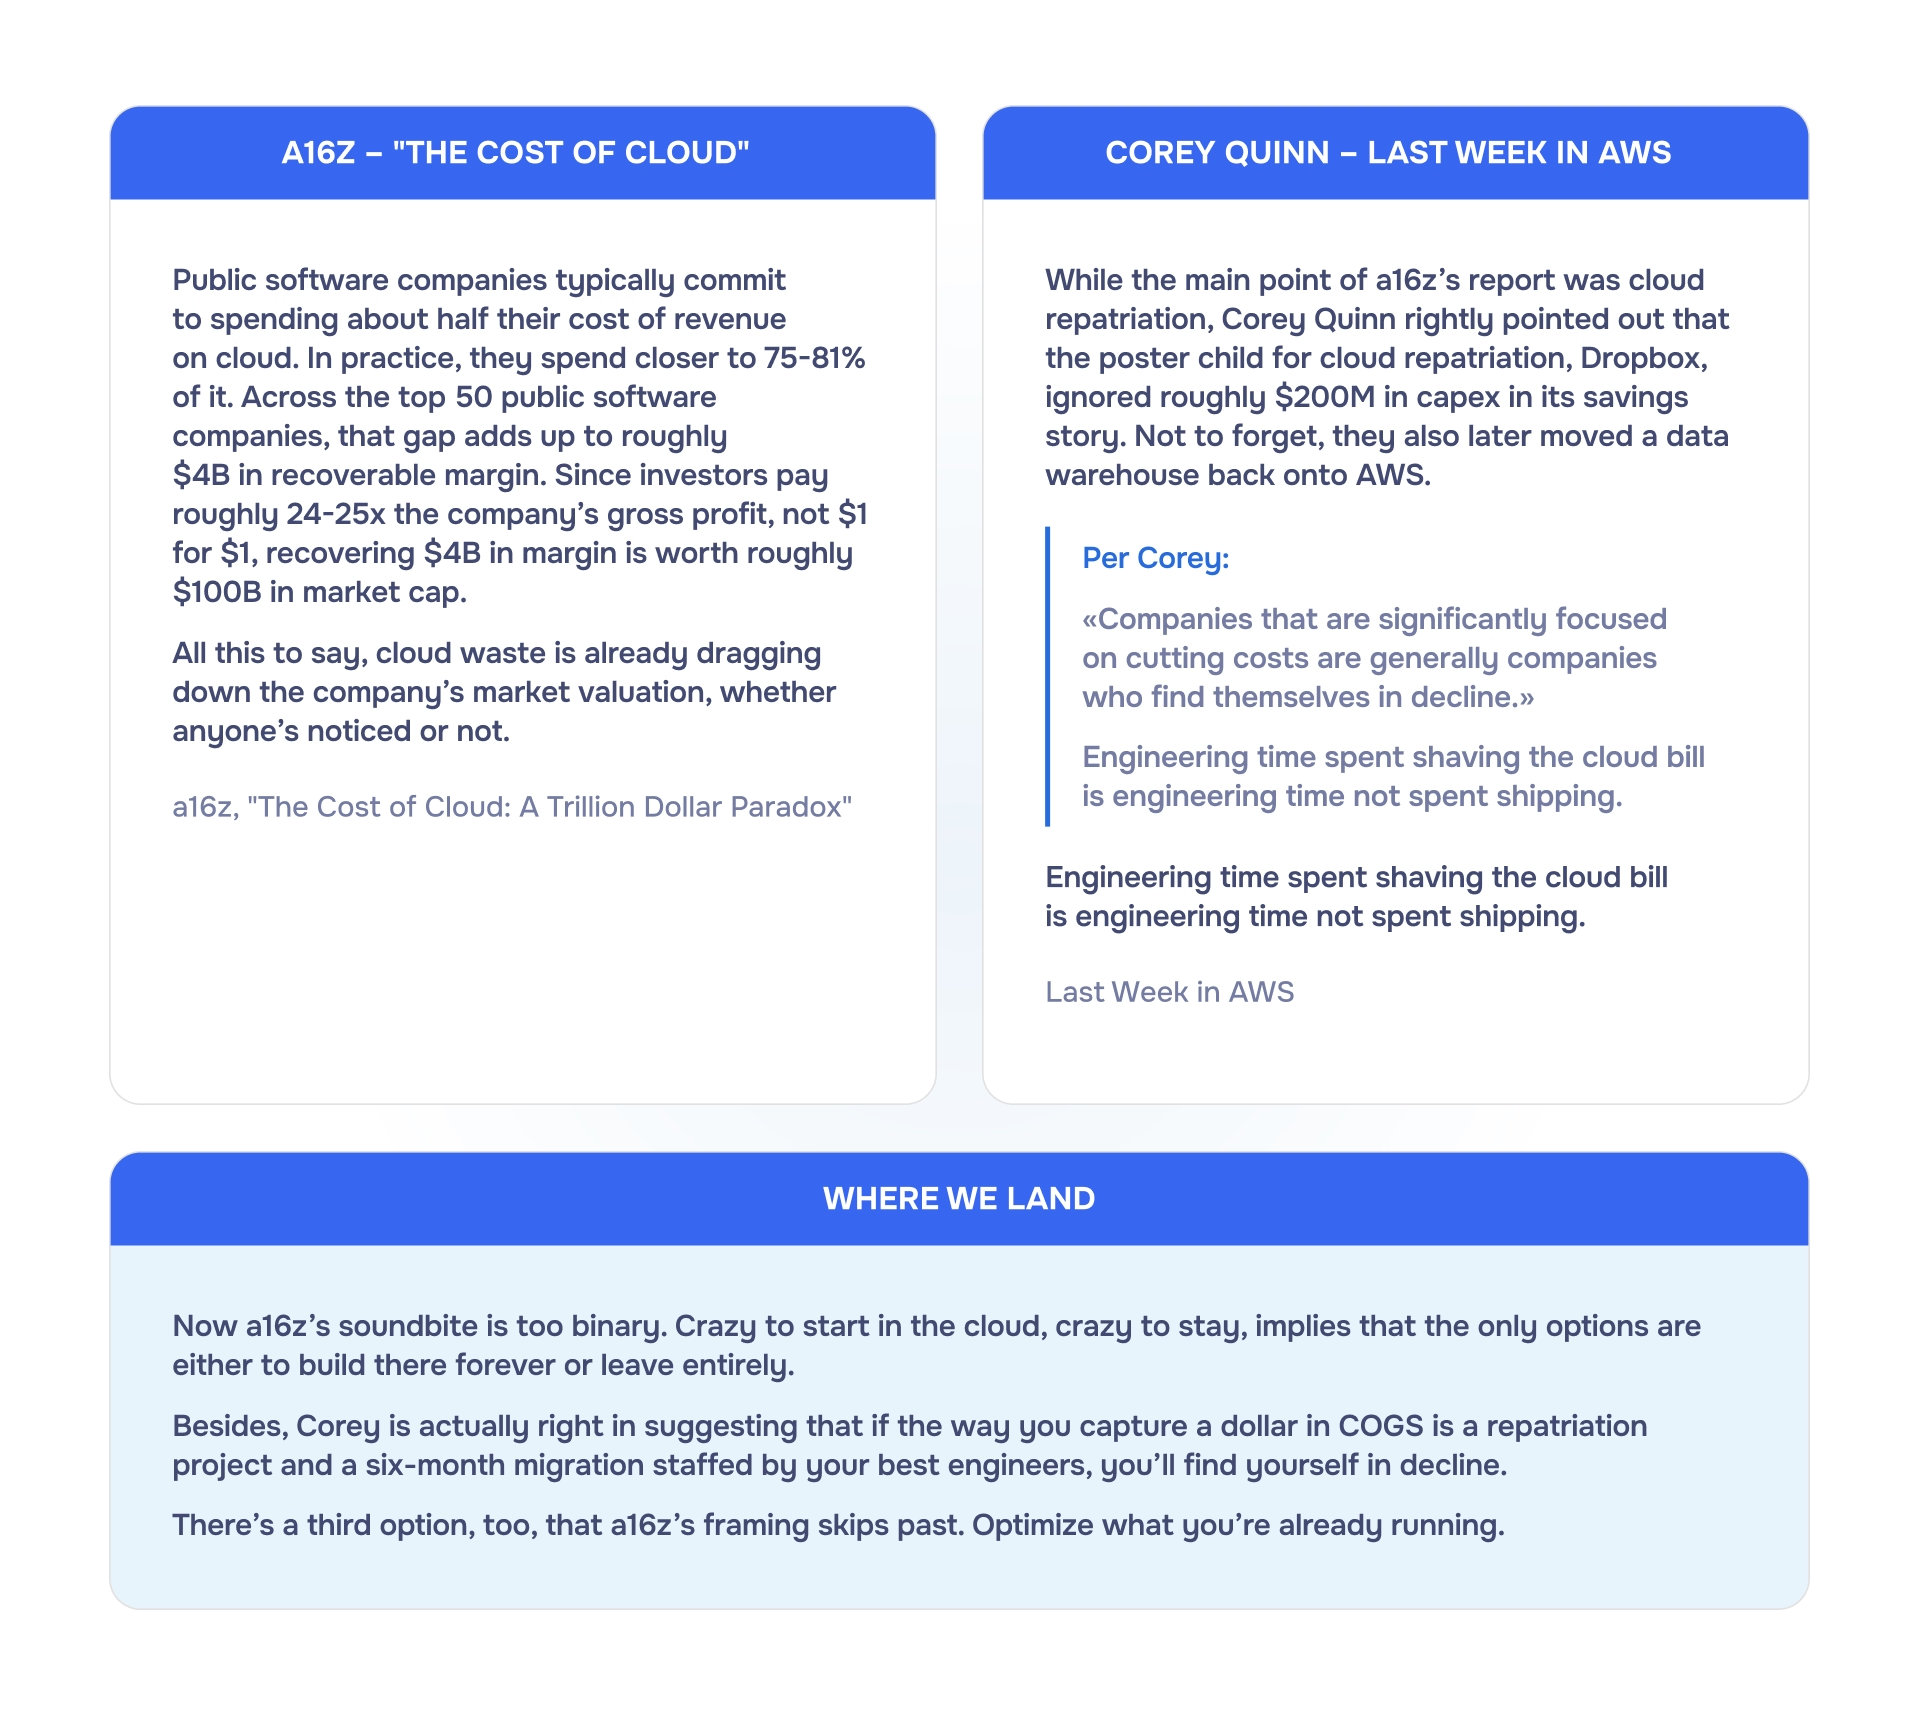
The elasticity tax a16z pointed at, still quietly doing its work.
The org chart itself: engineering owns the infrastructure, finance owns the budget, and the bill sits in the gap between two people who each assume the other one is watching it.
Waste climbed to 29% in 2026, right as AI workloads started showing up on invoices.
The forgotten wrinkle in your latest cost model
58% of organizations are now running generative AI workloads in production, and "unpredictable usage" is one of the top concerns teams raise about it, right behind security. The FinOps Foundation’s 2026 survey found that 98% of FinOps teams now include AI in their scope, up from 63% a year earlier, and AI cost management is the single most in-demand skill in the field.
Most SaaS companies bolting an AI feature onto their product are unknowingly exacerbating the cloud issues the industry had been trying to solve, just with GPUs instead of VMs. Usage is genuinely hard to forecast because it depends on how customers use a feature that launched eight weeks ago, and there’s often a fourth or fifth provider in the mix now too, a specialized GPU cloud nobody wrote a rate card for.
What actually lowers the numbers on your invoices
We covered a lot of this ground already in emma’s SaaS Cloud Cost Guide, so consider this the short version. A few known knowns, worth repeating because most companies still skip them.
Commit against your trough, not your peak. The elasticity tax exists because companies size commitments for their busiest month, then pay full rate the other eleven months.
Put the unit number in front of engineers every week, not once a quarter — cost per customer, per workspace, per feature, whatever the right denominator is for the business. The share of companies tracking unit economics rose from 40% to 49% in a year, which is progress. It also means roughly half of companies still can’t answer "what does our biggest feature cost us per customer," which, come to think of it, is an odd thing not to know about your own product.
Check where the cost actually lives before trusting the margin number. Infrastructure costs that get filed under engineering instead of COGS make gross margin look better than it really is, and nobody notices until someone actually goes looking.
Back to that Slack message
Next time it shows up with a screenshot of a chart that only goes up, you look into it — instead of promising to. Whether that number moves gross margin by two points or ten is up for grabs, but it’s worth finding out.
If you’re hitting a wall getting from "we should probably look at this" to an actual number, book a demo with emma.