Brief: Turning cloud spend into a defendable number.
Cloud is now software's biggest cost after payroll — and 70% of teams still can't say where it goes. It isn't a spending problem. It's a visibility one. Here's how to make cloud cost defensible.
You probably already suspect you're overpaying for cloud. You're likely right. But that's not your real problem.
Public cloud spending hit roughly $723 billion in 2025, according to Gartner, and at current growth rates it's on track to approach $880 billion in 2026. For many software companies, cloud is now the largest cost line after payroll. And a stubborn share of it is wasted: Flexera's 2026 State of the Cloud puts estimated waste at about 29%, while 85% of organizations now call managing cloud spend their single biggest cloud challenge, and roughly 17% report their budgets overshooting this year.
The deeper issue isn't the size of the bill, though. It's that almost nobody can explain it.
The numbers tell a consistent story. Only about 30% of organizations can confidently say where their cloud budget goes. Just 43% track cloud cost at the unit level — per customer, per feature, per team. And around 29% of cloud spend is simply wasted. (Sources: CloudZero, State of Cloud Cost Intelligence, for visibility and unit-cost tracking; Flexera, 2026 State of the Cloud, for waste.)
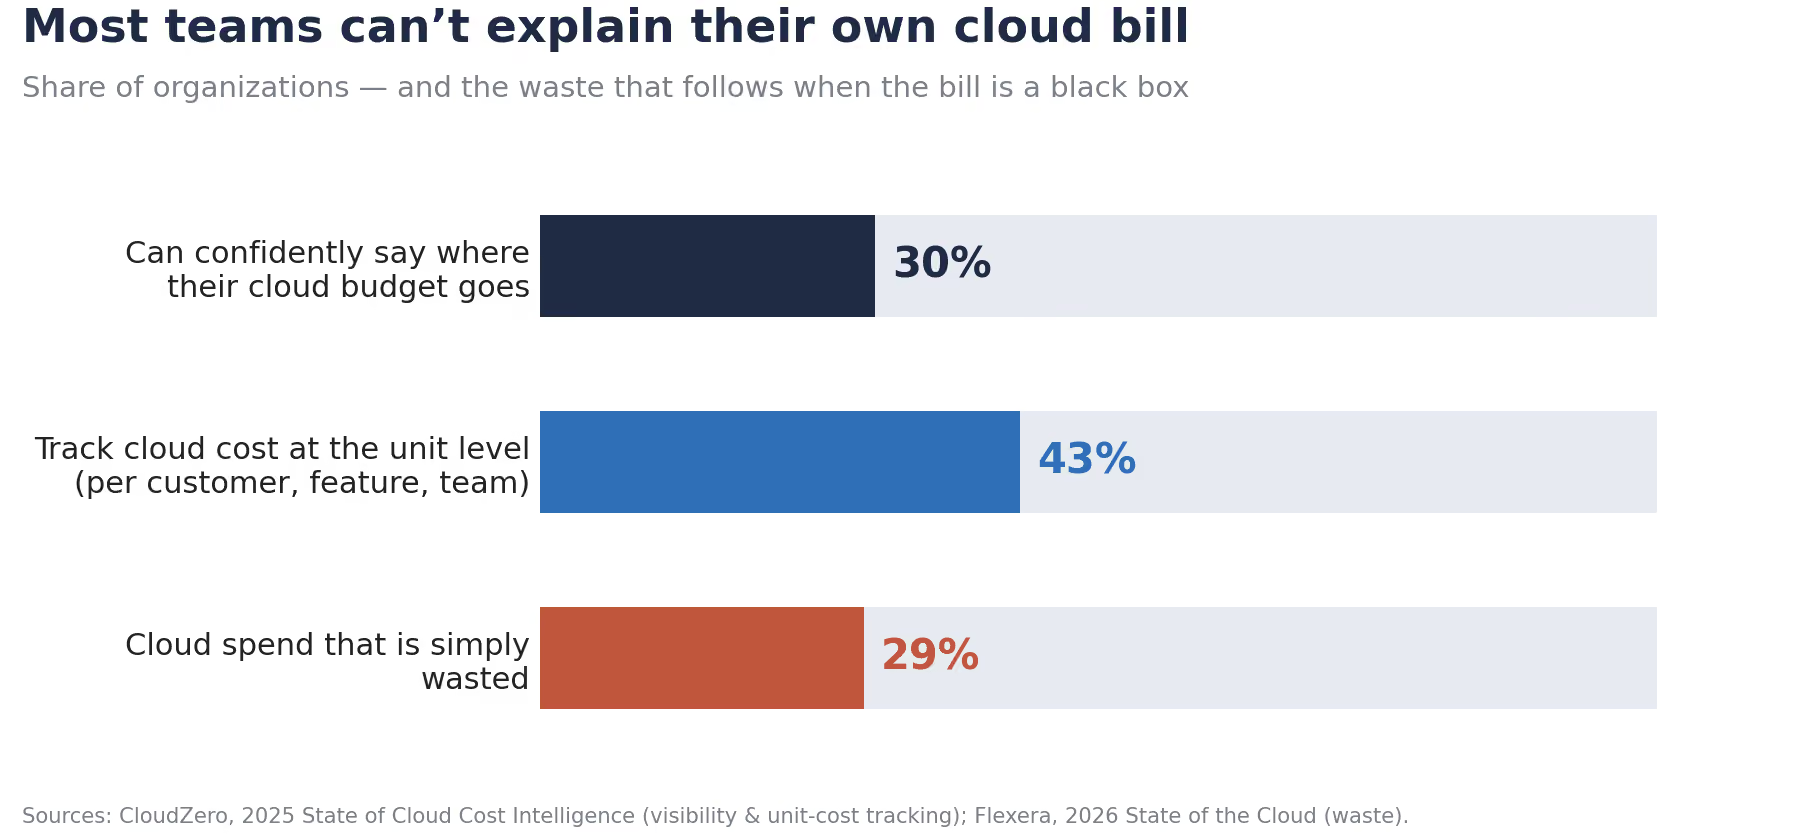
Read that as a diagnosis. Most teams don't have a spending problem — they have a visibility problem. Overspend is the symptom; the black box is the disease. And you can't fix what you can't see.
This pattern holds up in the field. Across 400+ recent cloud buying conversations we analyzed, cost came up in roughly three out of four. But the most common pain wasn't "it's too expensive." It was a version of: "we only find out what we spent when the bill arrives." The anxiety is rarely about the number itself — it's about not being able to see or steer it.
Three structural forces make modern cloud spend genuinely hard to read. Naming them is the first step to fixing them.
Tagging breaks down at exactly the scale you need it. The default plan is "we'll tag everything." In practice, tag-dependent approaches leave 15–30% of spend unallocated in most environments. Shared services, multi-tenant platforms, and Kubernetes clusters can't be cleanly tagged at all — one cluster serves many teams, products, and customers at once. The moment a resource is untagged or inconsistently tagged, its cost vanishes into an "unallocated" pool nobody owns.
The estate is fragmented — often by accident. Hybrid is now the norm at about 73% of organizations, and multi-cloud keeps rising, frequently driven by mergers and team silos rather than deliberate strategy (Flexera). Layer on SaaS tools, data platforms, and AI APIs — each with its own bill, format, and billing cadence — and your true "cloud" cost is scattered across consoles that don't reconcile with one another. No single view means no single answer.
The bill arrives weeks after the decision that caused it. A monthly invoice lands long after the deploy, the misconfigured autoscaler, or the dev environment left running over the weekend. AI and Kubernetes workloads can spike in minutes. By the time the cost shows up on a statement, the money is already spent and the context is cold. Detecting spend at month-end is, structurally, always too late.
The one-sentence version: your bill tells you what you spent — not who spent it, what drove it, or whether it was worth it.
The teams that get cloud cost under control stop asking "how do we cut the bill?" and start asking "what does a unit of our business cost to run?" That means unit economics: cost per customer, per tenant, per feature, per transaction, per AI inference. A raw bill can't answer whether spend was justified. A cost-per-unit tied to revenue can.
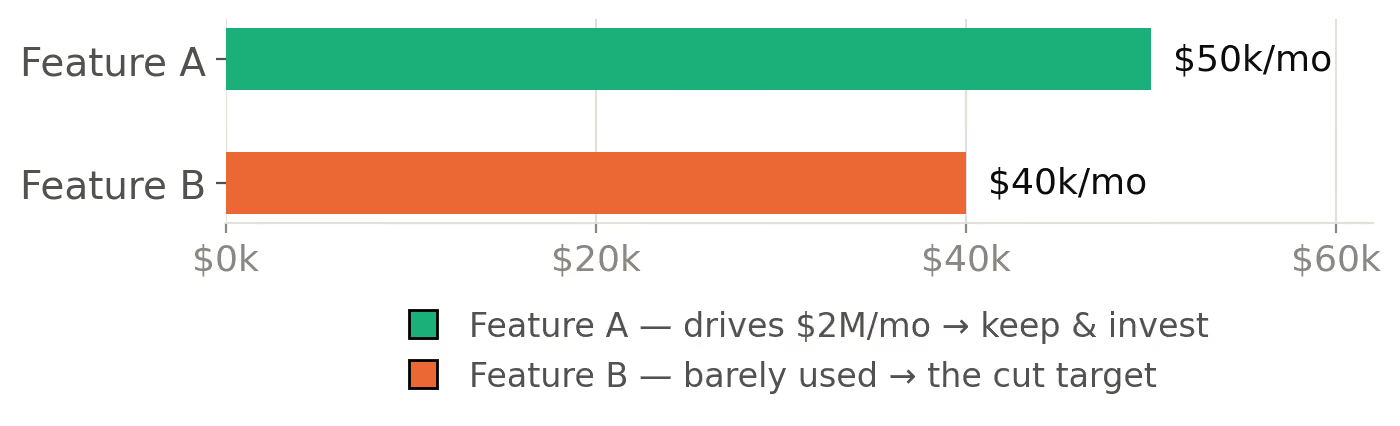
Why this isn't academic — consider a concrete example. A feature that costs $50,000 a month but drives $2M in revenue is not a cost-cutting target. A feature that costs $40,000 a month and is barely used is — even though its absolute spend is lower. Total spend is the wrong lens. Cost relative to value is the right one, and it routinely flips which "expensive" things you should actually leave alone. The cheaper feature is often the one to cut.
For a SaaS business, this lands directly on the P&L: cloud is the cost of goods sold. Your cost to serve a customer shapes gross margin, pricing, which segments are worth chasing, and the efficiency story investors underwrite. A useful executive metric is your Cloud Efficiency Rate — cloud cost as a share of revenue.
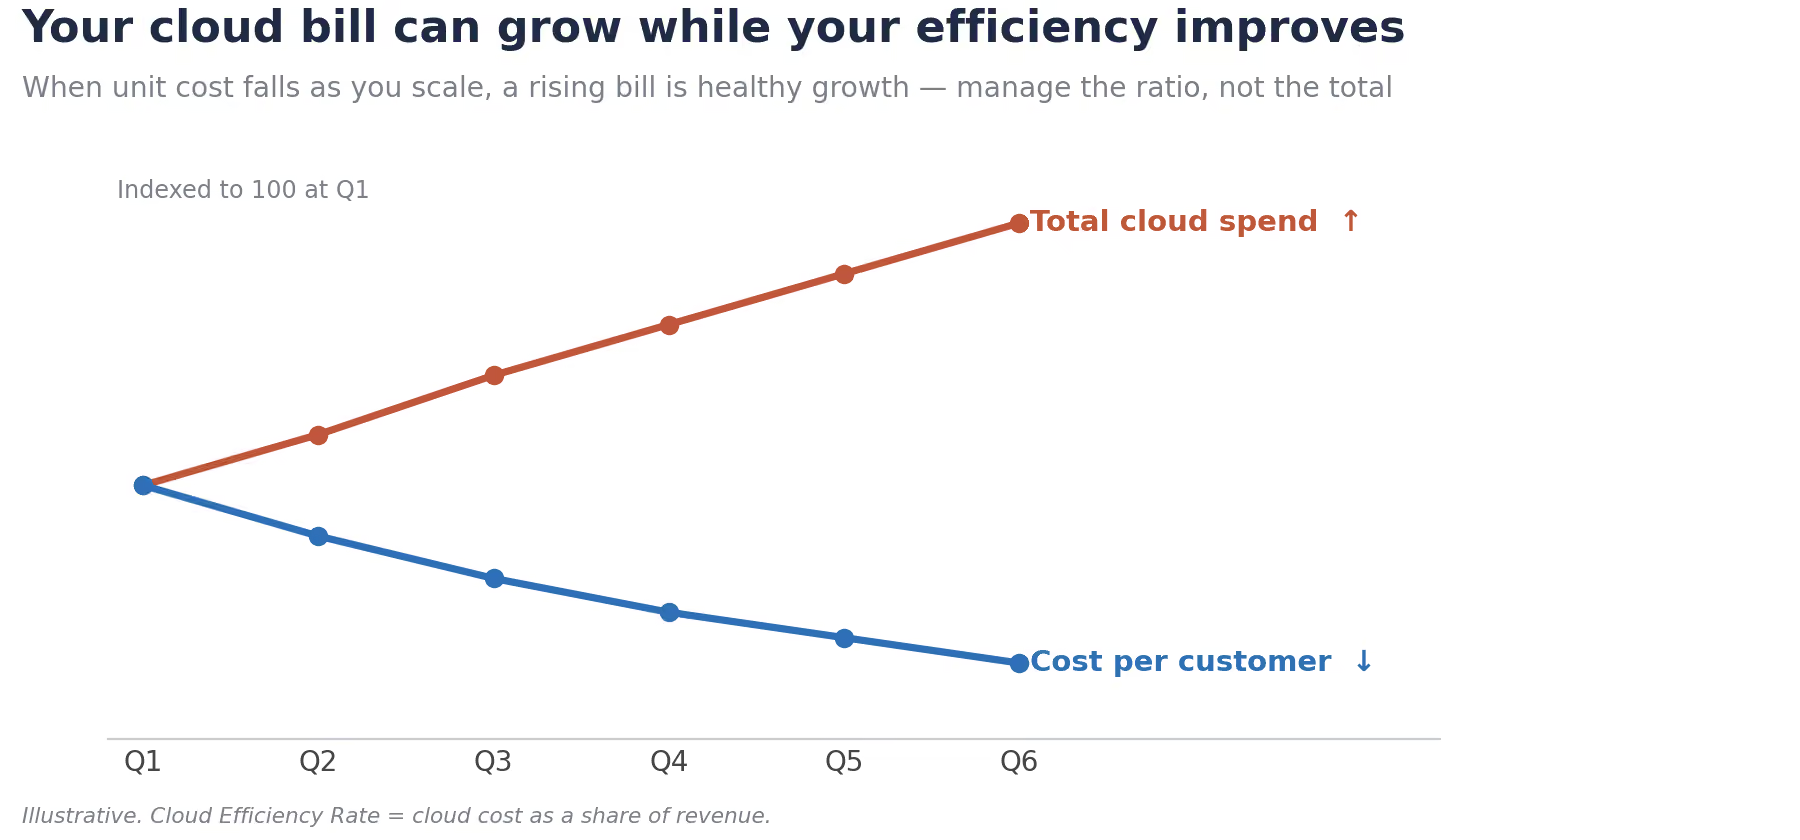
The counterintuitive truth it reveals: your cloud bill can grow while your efficiency improves, as long as unit costs fall as you scale. Picture total cloud spend rising quarter over quarter while cost per customer steadily declines — that's healthy growth, not a fire to put out. That single reframe moves the board conversation from "stop spending" to "improve the ratio."
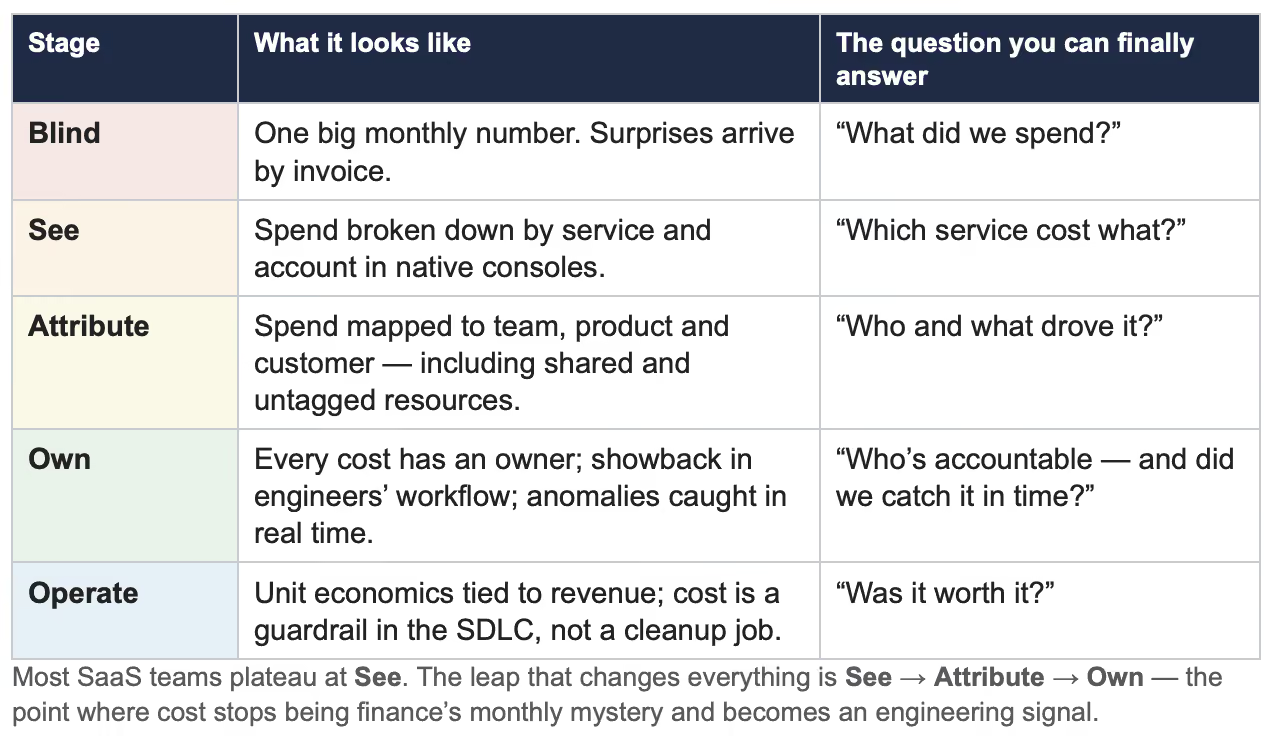
Cloud cost maturity is a climb from a single number to a defensible ratio. The uncomfortable finding across the industry: most organizations are stuck on the bottom rungs. They've bought dashboards and achieved some visibility, but they don't act on it. Visibility nobody acts on is just decoration.
Read these aloud with your engineering and finance leads. If you can't confidently answer seven of them, the gap is visibility, not budget.
Skip the table stakes ("right-size your instances," "buy a dashboard"). These are the moves that separate teams who control cost from teams who just watch it.
"Measure cost per customer" is good advice, but the blended average is nearly useless — it hides the actual problem. What changes decisions is the distribution: rank every customer or tenant by cost-to-serve and lay it against what they pay.
You'll almost always find two things — a few "underwater whales" (big logos on flat or heavily discounted contracts quietly burning gross margin) and a free/trial tier that costs more to serve than your paying base. That one ranked list reframes pricing, renewal terms, and which segments to chase far more than any total-spend chart. Pick one unit metric to start — but make it the one tied to a P&L decision you're about to make: a renewal, a new tier, a pricing change.
This is the 2026 trap. AI spend is supplementary — it adds cost, it doesn't replace it. It's usage-metered, it can spike in minutes, and it usually hides inside compute and managed-service line items instead of a clean "AI" line, so it's invisible exactly when it's growing fastest.
The non-obvious risk for SaaS: AI features are often priced flat but cost variable, so your heaviest users can carry negative marginal margin. Meter inference cost per feature and per request, then put it next to whether that feature is monetized and how power users consume it. If cost-per-active-user on an AI feature is climbing toward its price, you have a pricing problem, not a cost problem.
Awareness campaigns don't change behavior — accountability does. Hand each team a unit-cost number they're responsible for, tracked the way they'd track latency or uptime. When a cost target sits in the same dashboard as an availability target, it stops being finance's problem and becomes an engineering one.
"Use reserved instances and savings plans" is table stakes — and fewer than half of teams even do it. The non-obvious part is how much to commit. A growth-stage SaaS that commits to 100% of current usage will over-buy right before it re-architects, moves to ARM/Graviton, or shifts regions for data residency — and gets locked into the wrong thing.
The discipline: commit only to your usage floor (the trough you never drop below), cover roughly 70–80% rather than 100%, and layer flexible savings plans over reserved instances so a re-platforming doesn't strand the commitment. Commitments are a bet on your baseload — size the bet to what you're actually certain of.
"Treat cost as a non-functional requirement" is true but toothless as usually stated. Make it concrete: add one line to your architecture/design-review template, next to latency and availability — a new service must declare its target unit cost (per request, per tenant, per inference) before it ships.
Then forecast that unit cost at 10×. If cost-per-customer rises as you scale instead of falling, you've found an architecture problem while it's still cheap to fix — not after it's baked into COGS. That's the difference between governance as prevention and governance as monthly cleanup, and it's why governance is the fastest-rising priority in the field: cleanup doesn't scale.
Move 6 — Normalize before you compare. AWS, Azure, and GCP line items aren't comparable until you map them to a common schema — the FOCUS standard. Until then, "are we cheaper on X?" is simply unanswerable. Normalization is the unglamorous prerequisite that makes every multi-cloud cost question tractable.
Cloud cost is not a finance project handed down for cleanup. The spend is created by architecture decisions, it shows up as COGS, and it's priced by product. Solving it is a three-legged stool:
What aligns them is a single shared number everyone trusts: your cost per customer and Cloud Efficiency Rate, trended over time. When engineering, finance, and product argue from the same number, the conversation shifts from blame to trade-offs — which is where good decisions get made.
First 30 days — see clearly. Consolidate every cloud, SaaS, and AI bill into one view. Find your top five cost drivers and your unallocated percentage. Choose one unit metric tied to a decision you're about to make.
By 60 days — attribute and own. Allocate spend to teams, products, and customers, including shared clusters by consumption. Stand up showback and one real-time anomaly alert. Rank customers by cost-to-serve; kill idle headroom; commit to the trough.
By 90 days — operate. Publish cost per customer and your efficiency ratio to engineering, finance, and product. Add a unit-cost target to your design-review template. Set a quarterly target tied to the ratio, not the absolute bill.
Stop staring at the total. Put your unit metric — cost per customer — and its trend against revenue per customer where the team can see it. That single ratio turns "are we overpaying?" from a recurring anxiety into a question you can answer, trend, and defend. It's also the move that turns cloud cost from a finance fire drill into an engineering habit — which is the only version of cost control that lasts.
This brief was put together by the team at emma. If a second set of eyes on your own estate would help — a quick read on your top cost drivers, your unallocated spend, and your cost-to-serve across clouds — that's a conversation we're glad to have. No deck required.