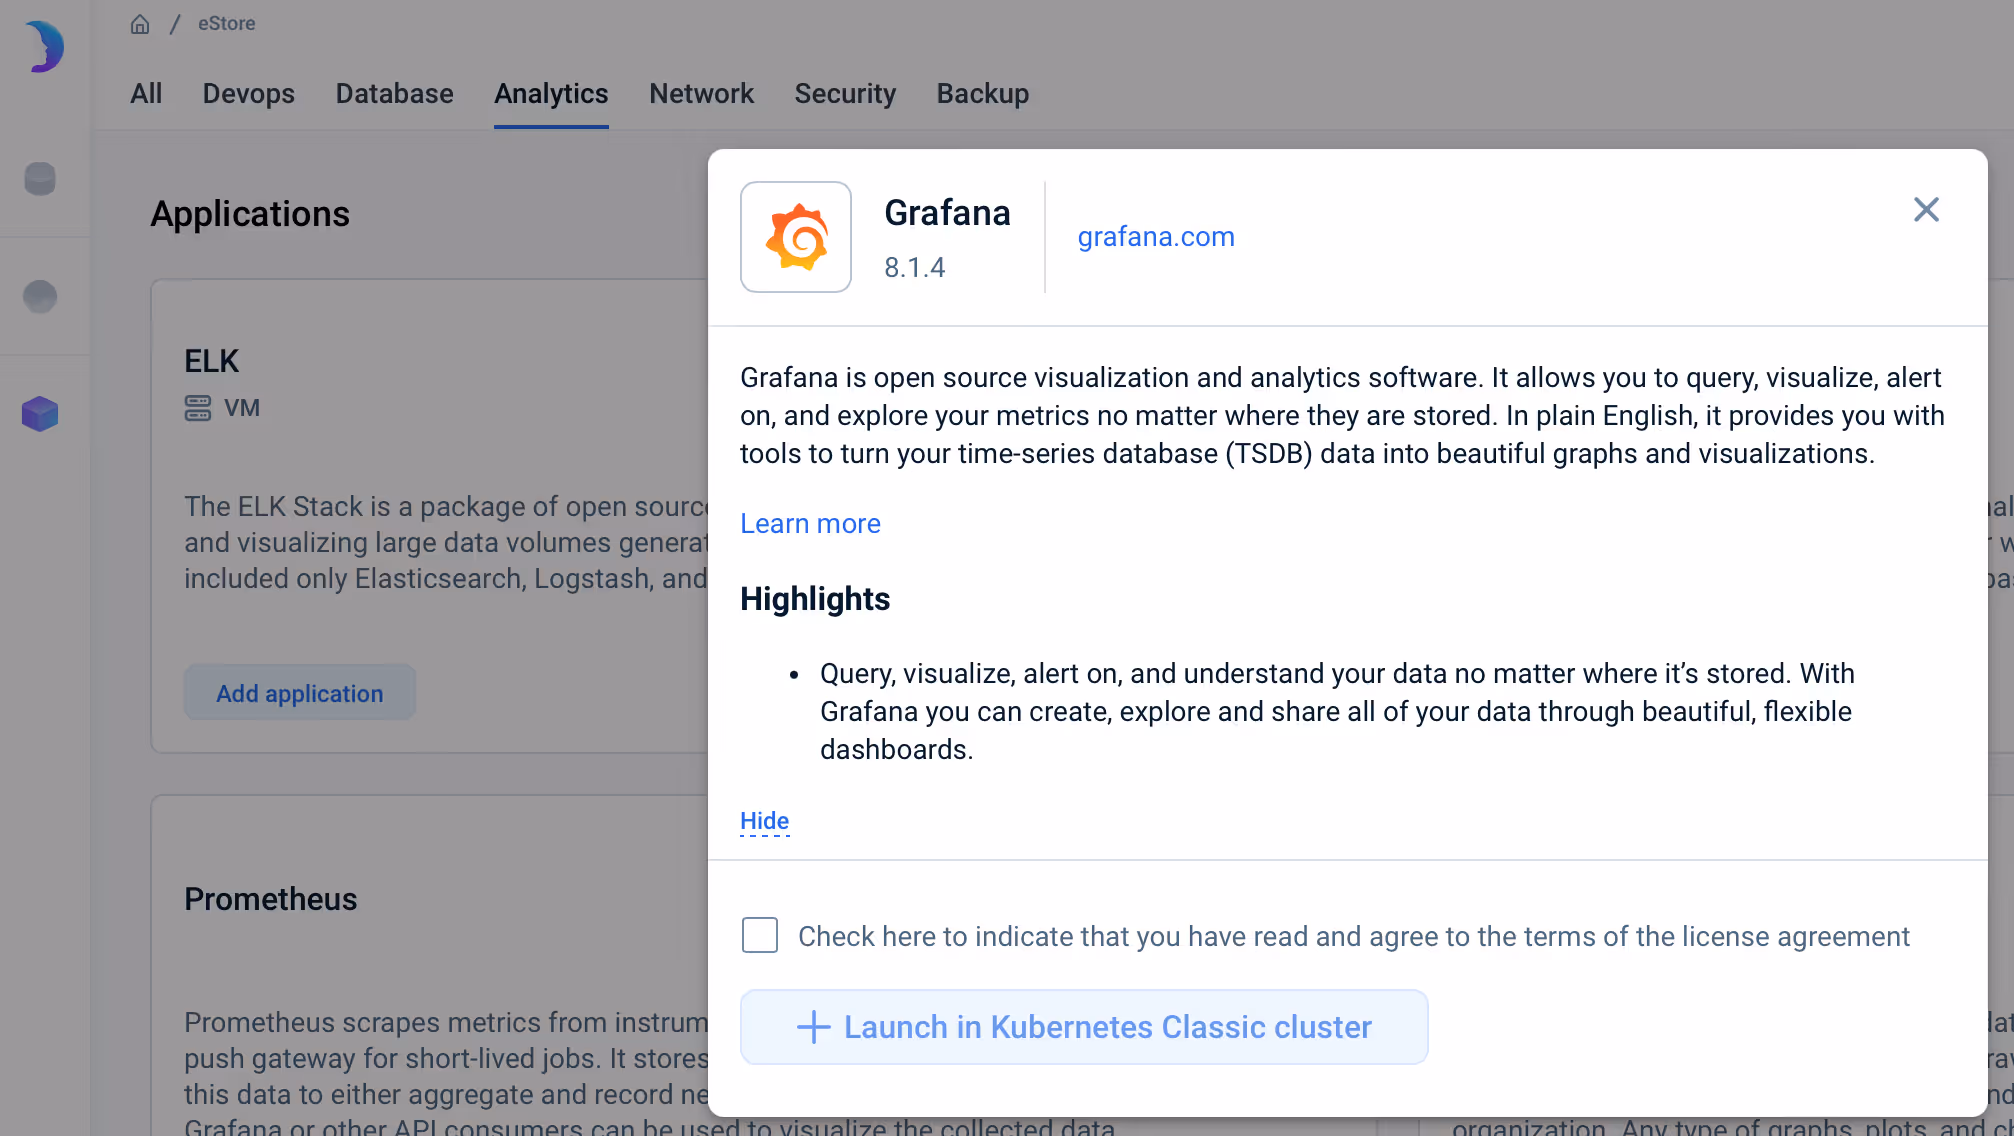
Grafana is open source visualization and analytics software. It allows you to query, visualize, alert on, and explore your metrics no matter where they are stored.
Grafana is an open-source visualization and analytics software that enables teams to visualize and explore time-series data from across their infrastructure, applications, and services. It supports a wide range of data sources and helps users turn their time-series database (TSDB) data into interactive graphs and visualizations for easier analysis and monitoring.
How Grafana Helps Users
With Grafana, you can:
Query and understand your data no matter where it’s stored – across cloud infrastructure, Kubernetes clusters, databases, and more
Connect to a wide range of data sources, including Prometheus, MySQL, PostgreSQL, and more
Correlate data – metrics, logs, and traces – across multiple systems in a single pane of glass
Identify, monitor, and track trends over time
Define alert rules and trigger notifications based on system behavior
Why Integrate Grafana with emma
Connect infrastructure, resource, and cost metrics collected by emma with Grafana dashboards.
Overlay usage anomalies, cost trends, and policy-based recommendations from emma onto Grafana visualizations.
Set up custom alerts in Grafana based on real-time performance and cost metrics from emma.
Identify and resolve issues faster by combining emma’s insights with Grafana’s interactive dashboards and alerting system.
Integrate Grafana with emma for unified observability and operational insights in one powerful view.