GPU observability at VM and cluster level. Zero additional tooling.
GPU metrics at both VM level and managed Kubernetes (mk8s) cluster level — including power, temperature, and clock speed. No agents. No exporters. No third-party integration required.
Most teams provision GPU infrastructure without any visibility into whether it's actually being used. Utilization data lives behind SSH sessions, provider-specific dashboards, or third-party agents that nobody configured. The result: expensive GPUs sit idle, thermal issues go undetected, and right-sizing decisions are based on guesswork.
Idle GPUs are invisible costs
Without utilization metrics, you can't distinguish between a GPU running a training job and a GPU someone provisioned last week and forgot to shut down. Both cost the same per hour.
Thermal throttling is silent
A GPU hitting thermal limits silently reduces clock speed and performance. Without temperature and power metrics, your training job runs slower than expected — and nobody knows why.
Right-sizing requires evidence
Should your team use H100s or A100s? L40S or T4? Without utilization data over time, every sizing decision is an opinion. Monitoring turns opinions into evidence.
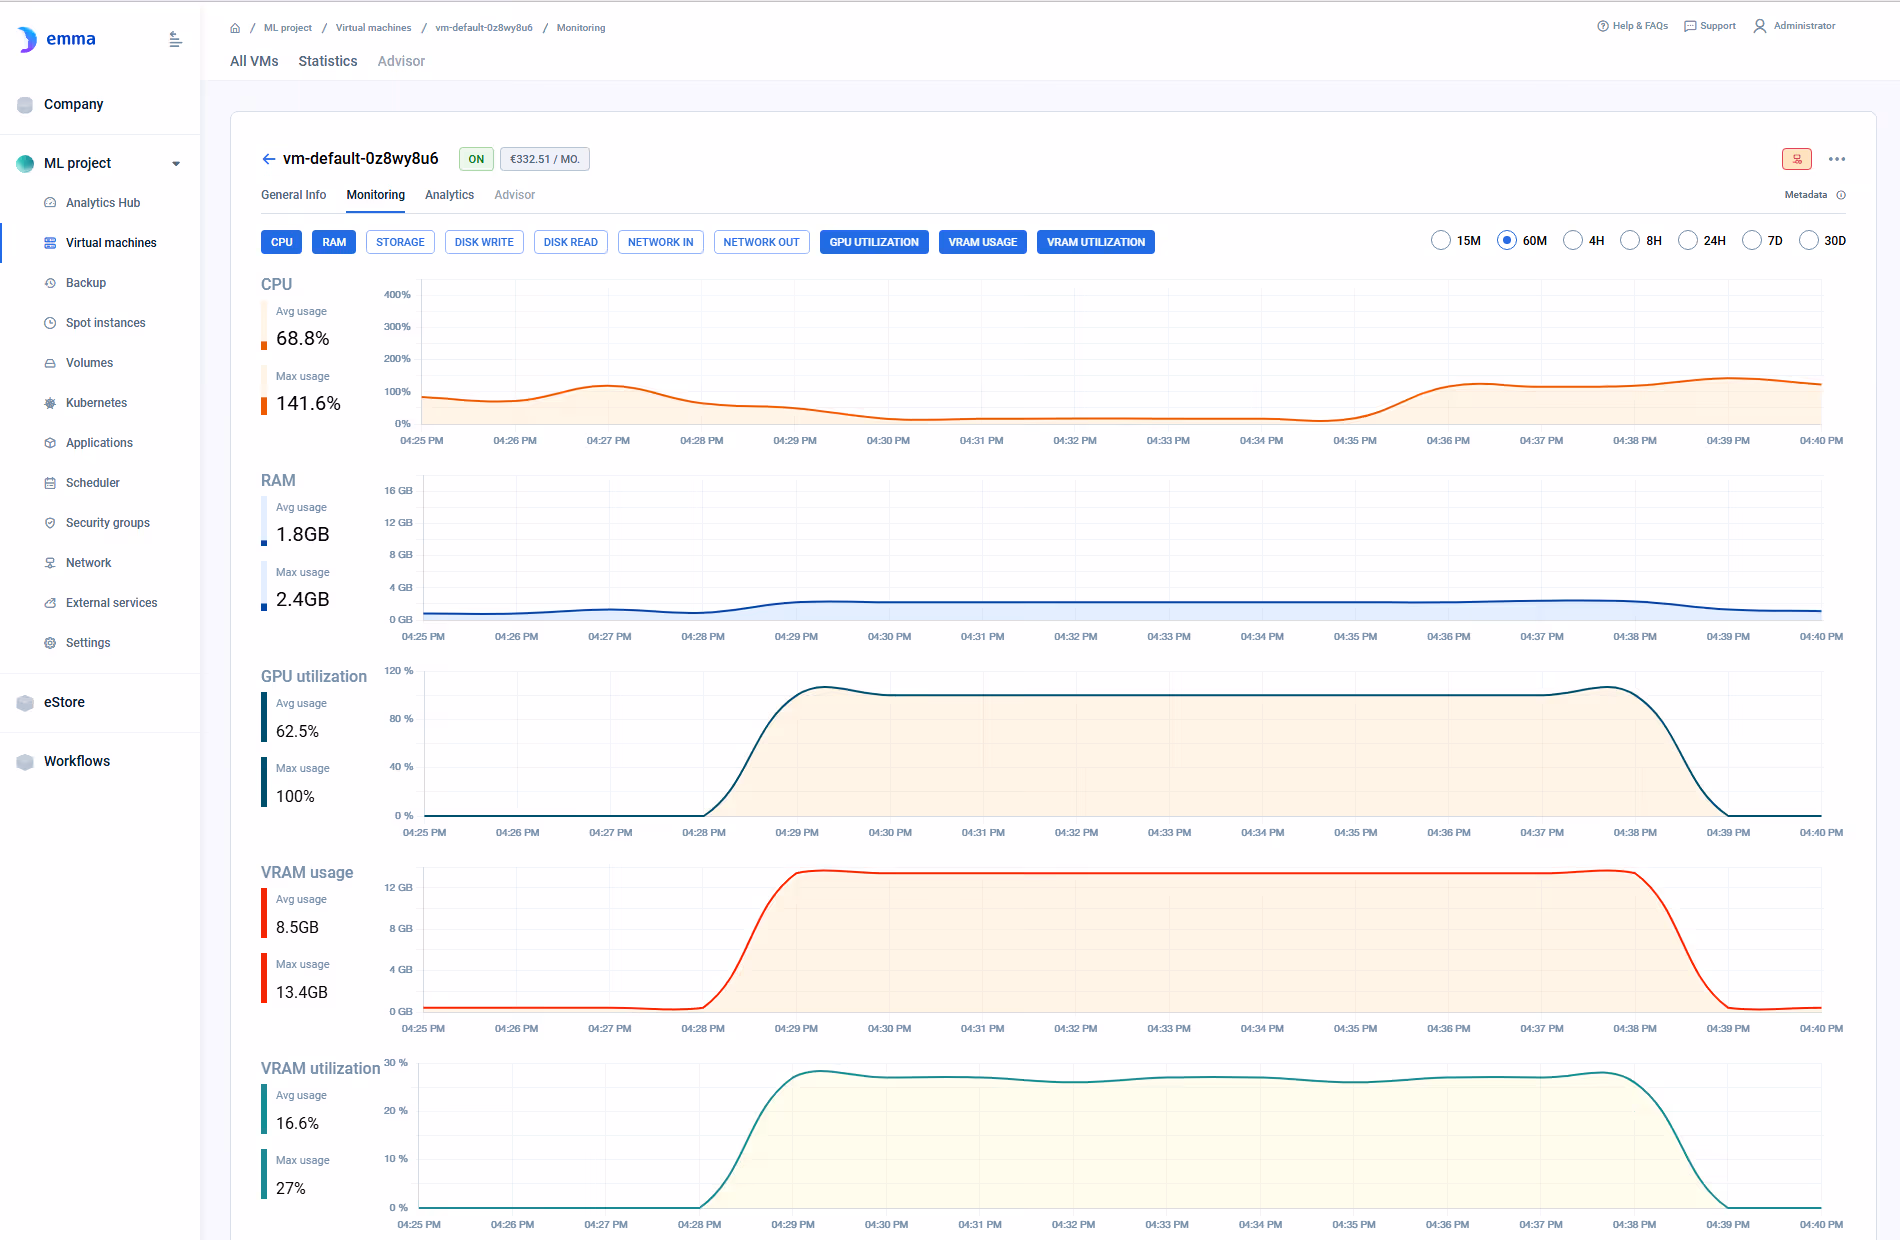
GPU VM monitoring
Three granular metrics for GPU-enabled VMs, integrated alongside CPU, memory, and network:
- •GPU utilization — active compute percentage
- •vRAM usage — memory currently allocated
- •vRAM utilization — memory subsystem activity
mk8s GPU monitoring
Nine metrics in the mk8s monitoring tab. Current values and trend charts. Zero setup:
- •GPU usage & Graphics usage
- •Active Memory & VRAM usage
- •Memory clock & core clock
- •Memory copy, power usage & temperature
GPU Utilization
Is the GPU actually computing? Low utilization on an expensive GPU means either the workload doesn't need this tier, or the job is bottlenecked elsewhere (data loading, CPU preprocessing). The evidence you need to right-size.
Memory (vRAM / VRAM Usage)
Is the model too large for the allocated memory? Is memory underutilized — meaning you're paying for capacity you don't need? Memory metrics drive model-to-GPU matching decisions.
Power & Temperature
GPUs approaching thermal limits throttle automatically — reducing clock speed and throughput silently. Power and temperature metrics detect throttling before it impacts SLAs. Available on mk8s clusters.
Clock Speed (Memory & Core)
Clock drops signal thermal throttling or power limiting. If core clock is below expected baseline, the GPU is underperforming. Comparing clock trends against utilization pinpoints the root cause.
GPU observability is expanding
Alerting, API access, and deeper cluster metrics are on the roadmap. Be the first to know when they ship.


Provider dashboards
AWS CloudWatch, Azure Monitor, GCP Cloud Monitoring — each shows GPU metrics for its own cloud only. Different metrics, different interfaces, different retention. No unified cross-cloud view. Context switching for every incident.
Datadog / Grafana + DCGM
Full-featured GPU observability — but requires deploying DCGM exporters, configuring Prometheus, maintaining dashboards, and paying for a separate monitoring platform. Operational overhead scales with every GPU cluster added.
emma GPU monitoring
GPU metrics natively integrated into the platform you already use for all other infrastructure. No agents. No exporters. No separate tool. Metrics appear automatically for any GPU-backed resource. VM and K8s. All providers.
Right-sizing GPU instances
Your team provisioned H100s for a training job. Utilization data shows the workload peaks at 40% GPU utilization with 30GB vRAM usage. Next run: A100s at half the cost. Without monitoring, you'd never know.
Detecting idle GPU infrastructure
A data scientist provisioned a GPU VM two weeks ago for an experiment. The experiment finished on day one. The VM is still running. GPU utilization: 0%. Without monitoring, it stays running until someone notices the bill.
Diagnosing training slowdowns
A training job is running 30% slower than expected. GPU utilization is high, but core clock has dropped below baseline. Temperature metrics show the GPU is thermal throttling. The fix: better cooling config or a different instance type — not more GPUs.
FinOps evidence for GPU spend
Your CFO wants to know if GPU infrastructure is being used effectively. Utilization trends over time — per team, per project — provide the evidence. Not a spreadsheet estimate. Actual usage data from the platform that provisions the infrastructure.
No agent, no exporter
Unlike Datadog (DCGM agent) or Grafana (custom plugin + Prometheus), emma delivers GPU metrics natively — no additional tooling to deploy or maintain.
Unified GPU + non-GPU visibility
GPU metrics alongside CPU, memory, network for the same resource. When a training job stalls, you see GPU utilization AND CPU bottleneck AND network throughput in one view. No manual correlation.
Health beyond utilization
mk8s monitoring includes power, temperature, and clock metrics — detecting thermal throttling, power issues, and clock anomalies that basic utilization dashboards miss entirely.
Do I need to install anything for GPU monitoring?
No. GPU metrics appear automatically for GPU-backed resources. No agents, no DCGM exporters, no Prometheus configuration. Metrics are available from the moment the GPU VM or mk8s cluster boots.
What's the difference between VM monitoring and mk8s monitoring?
GPU VM Monitoring provides 3 metrics (GPU Utilization, vRAM Usage, vRAM Utilization) for individual GPU VMs. mk8s GPU monitoring provides 9 metrics (including power, temperature, and clock speed) at the cluster level for GPU-backed nodes in managed Kubernetes clusters.
Can I set alerts on GPU metrics?
Alerting and notification workflows are not included in the current release. You can observe current values and trend charts in the monitoring interface. Alerting is on the roadmap.
How does this compare to using Datadog for GPU monitoring?
Datadog requires deploying DCGM exporters on every GPU host, configuring collection pipelines, and paying for a separate monitoring platform. emma delivers GPU metrics natively — no agents, no additional cost, no operational overhead. The trade-off: Datadog offers more advanced analytics and alerting. emma offers zero-setup GPU visibility integrated with provisioning and governance.
Can I use GPU monitoring for capacity planning?
Yes. Trend charts show utilization and memory usage over time. This data supports right-sizing decisions — whether your team needs H100s or A100s, whether GPUs are being fully utilized, and whether idle infrastructure should be reclaimed.
Does GPU monitoring work across all providers?
mk8s GPU monitoring works across all mk8s-supported providers (AWS, Azure, GCP). GPU VM Monitoring is currently available for AWS GPU VMs. The same monitoring interface applies regardless of provider.
Can I export GPU metrics to my existing monitoring tools?
Not in the current release. GPU metrics are available in emma's monitoring interface. API access to metrics and integration with external monitoring platforms are on the roadmap.
See GPU monitoring live — VM-level and cluster-level.
45-minute demo. Real metrics. Real infrastructure. No slides.
Get a demo →