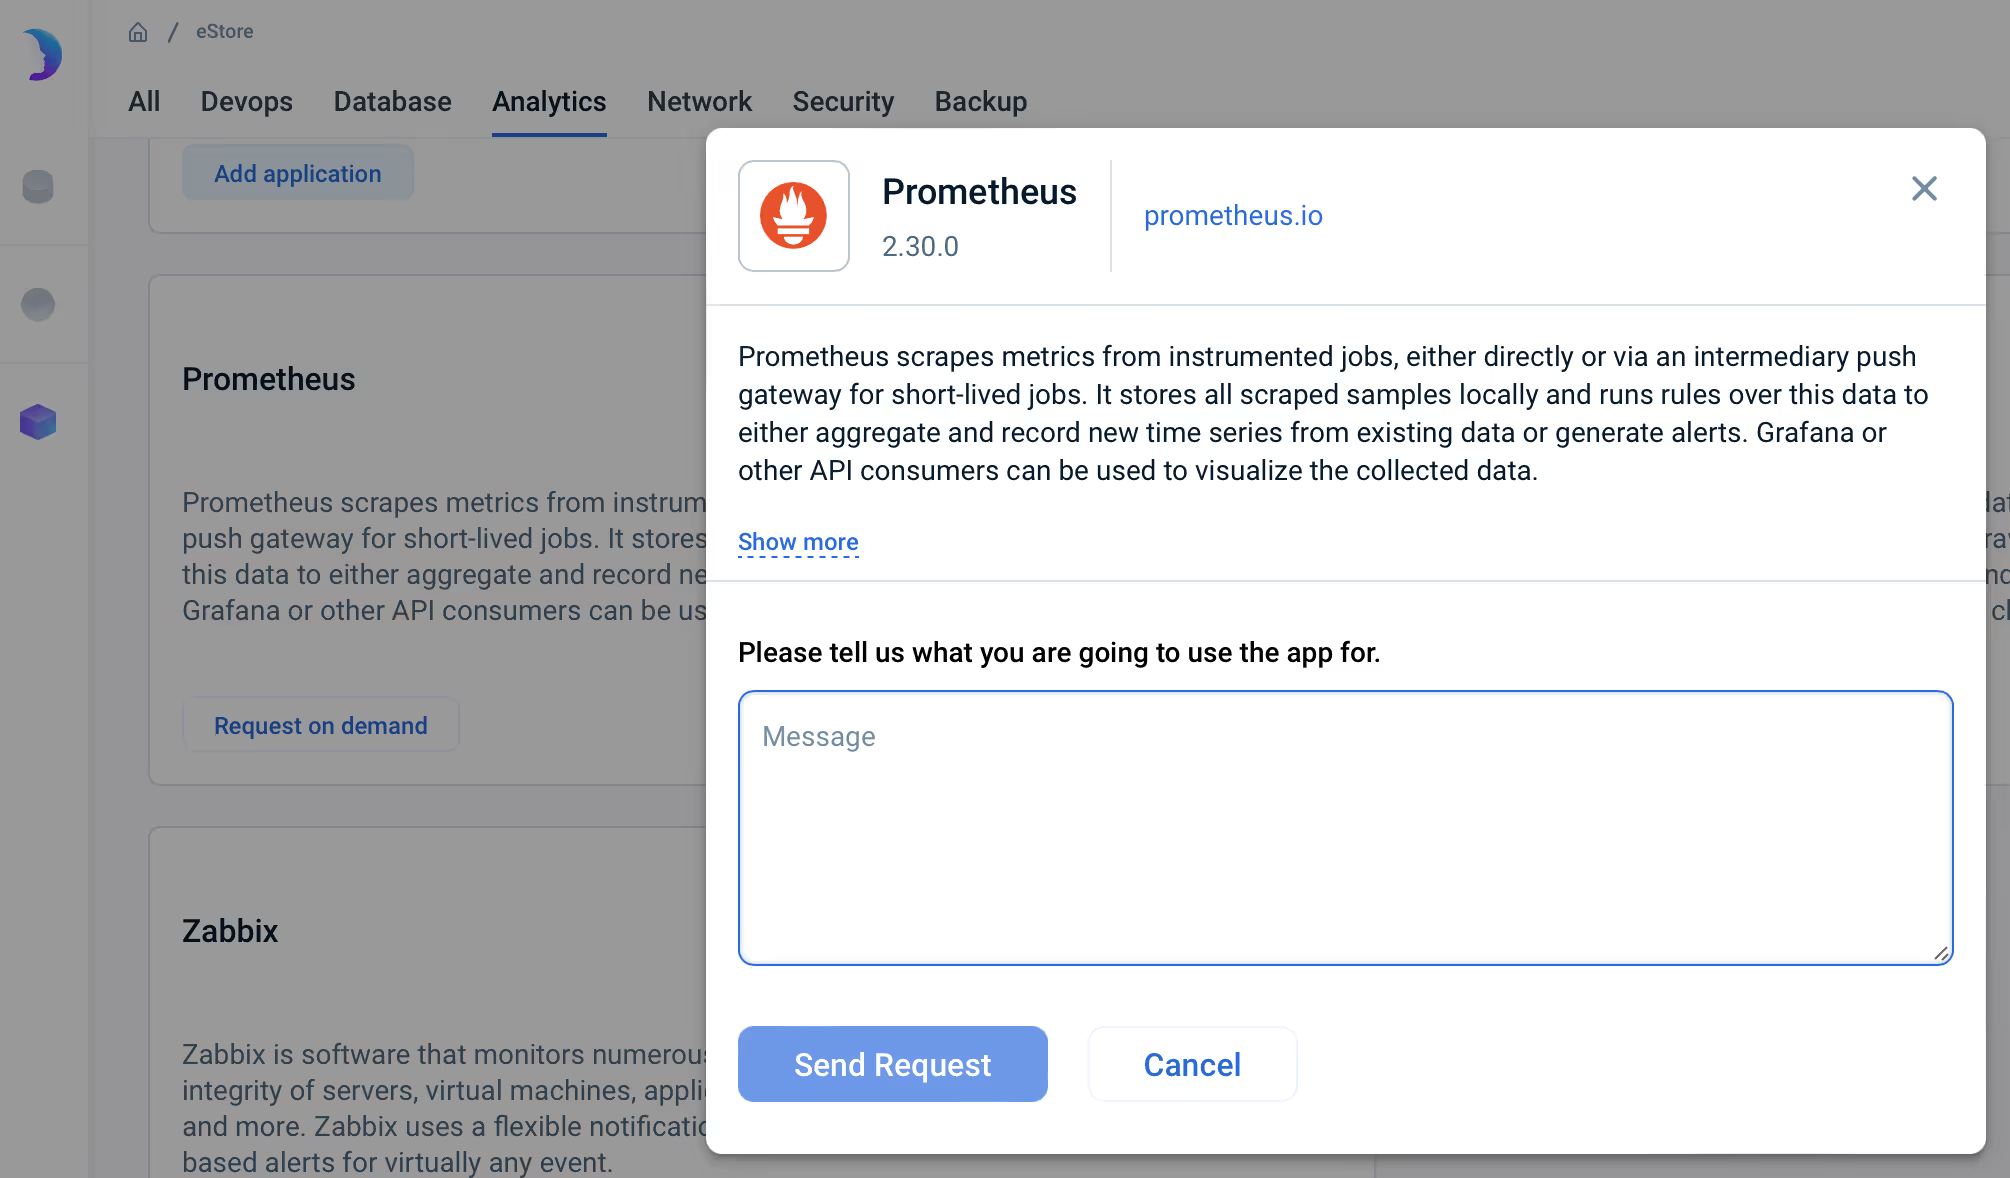
Prometheus is an open-source system monitoring and alerting toolset. It collects and stores time-series data across infrastructure and application components, especially in cloud-native and containerized environments. It enables analysis and visualization of metrics over time through Grafana or other API consumers.
How Prometheus Helps Users
Prometheus enables you to:
Pull metrics data (application performance, response times, CPU and memory utilization, etc.) from targets (applications and infrastructure) periodically.
Store metrics as time-series data, each with a timestamp, for historical analysis and trend detection.
Monitor Kubernetes clusters, microservices, and system performance in real time.
Set up custom alerting rules and receive notifications via integrated alert manager.
Why Integrate Prometheus with emma
Access, monitor, and correlate infrastructure-level metrics and alerts from Prometheus and emma centrally.
Identify inefficiencies, such as persistent overutilization or underutilization of cloud resources.
Optimize cloud resources by combining telemetry from Prometheus and insights and recommendations from emma.
Integrate Prometheus with emma to manage and optimize hybrid and multi-cloud environments from a single pane of glass.